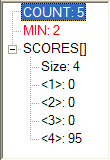
The Watch Window gives the user feedback on the values of all variables and arrays as a flowchart executes. Variables are arranged in the Watch Window in the order in which they are encountered as the flowchart executes. The variable being changed by the statement currently executing in the flowchart is shown in red.
Arrays are initially displayed minimized. To view the value of individual elements of an array, the user should click on the "+" symbol to the left of the array name. The values can be later hidden by clicking on the "-" symbol.
Note: nothing is displayed in the Watch Window until a variable or array is encountered during the execution of a flowchart.
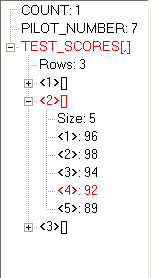
The image below is an example of how a two-dimensional array will appear in the Watch Window. Each row receives its own "+" sign that can be changed into a "-" sign (and vice versa) by clicking on the sign. The row number is indicated in brackets ("<1>", "<2>", etc.).
When the row has been expanded so that the "-" sign is showing, the number of columns is indicated next to the word "Size", followed by the individual values that have been assigned for that row. The "column" number precedes the value and is indicated in brackets. For example, the Watch Window displayed below indicates that the value of Test_Scores[2,4] is 92 (in other words, 92 is the value at row 2 and column 4 of array Test_Scores). Also note that the array name, row, and column for Test_Scores[2,4] is highlighted in red, which indicates that this value is being changed by the statement currently executing in the flowchart.